matplotlibで棒グラフ
matplotlib を使って棒グラフを描こうとしたら罠にはまったので忘れないうちに。
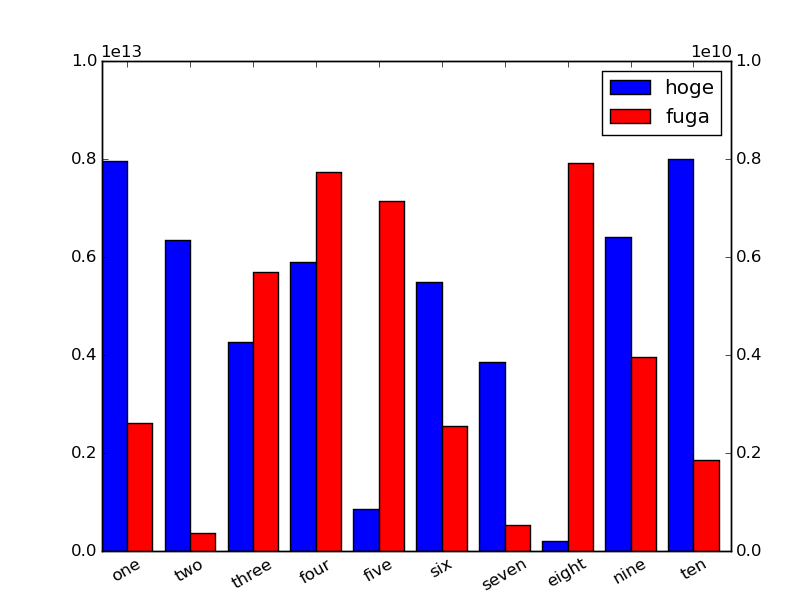
欲しかったグラフ

書かなければいけなかったコード
import matplotlib.pyplot as plt
import numpy as np
import random

width=0.4
x = [i for i in range(10)]
sftx = [i+width for i in x]
l = ["one", "two", "three", "four", "five",
	"six", "seven", "eight", "nine", "ten"]

y1 = [random.random() * 8e12 for i in range(10)]
y2 = [random.random() * 8e9  for i in range(10)]

fig, ax = plt.subplots()

ax2 = ax.twinx()
p1 = ax.bar(x,y1,width,label="hoge")
ax.set_ylim(0,1e13)
p2 = ax2.bar(sftx,y2,width,color="red",label="fuga")
ax2.set_ylim(0,1e10)
ax.set_xticks(sftx)
ax.set_xticklabels(l,rotation = 30)
p = [p1,p2]
ax.legend(p,[i.get_label() for i in p])
plt.show()
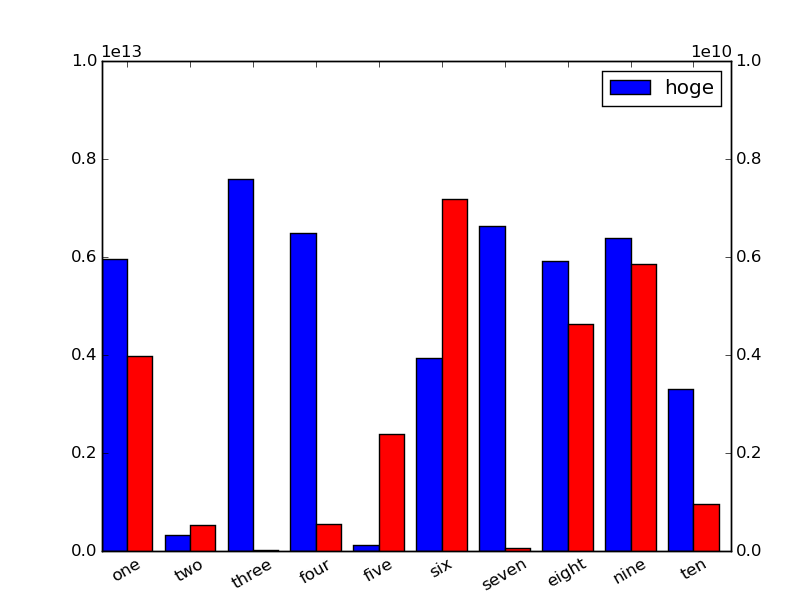
欲しくなかったグラフひとつめ。

凡例がひとつしか表示されてません。legendを単純に呼ぶだけではいけません。このへんを参考にしてコードを描こうとすると罠に落ちる。
pylab_examples example code: barchart_demo.py — Matplotlib 1.5.0 documentation
subplots_axes_and_figures example code: fahrenheit_celsius_scales.py — Matplotlib 1.5.0 documentation
書いてしまったコード
import matplotlib.pyplot as plt
import numpy as np
import random

width=0.4
x = [i for i in range(10)]
sftx = [i+width for i in x]
l = ["one", "two", "three", "four", "five",
	"six", "seven", "eight", "nine", "ten"]

y1 = [random.random() * 8e12 for i in range(10)]
y2 = [random.random() * 8e9  for i in range(10)]

fig, ax = plt.subplots()

ax2 = ax.twinx()
ax.bar(x,y1,width,label="hoge")
ax.set_ylim(0,1e13)
ax2.bar(sftx,y2,width,color="red",label="fuga")
ax2.set_ylim(0,1e10)
ax.set_xticks(sftx)
ax.set_xticklabels(l,rotation = 30)
ax.legend()
plt.show()
欲しくなかったグラフふたつめ

x軸に表示させてるそれぞれの棒につけた名前が斜めに表示されてない。この辺を参考にしてコードを描こうとすると罠に落ちる。
ticks_and_spines example code: ticklabels_demo_rotation.py — Matplotlib 1.5.0 documentation
axes_grid example code: demo_parasite_axes2.py — Matplotlib 1.5.0 documentation
書いてしまったコードその二
import matplotlib.pyplot as plt
import numpy as np
import random
from mpl_toolkits.axes_grid1 import host_subplot
import mpl_toolkits.axisartist as AA

width=0.4
x = [i for i in range(10)]
sftx = [i+width for i in x]
l = ["one", "two", "three", "four", "five",
	"six", "seven", "eight", "nine", "ten"]

y1 = [random.random() * 8e12 for i in range(10)]
y2 = [random.random() * 8e9  for i in range(10)]

host = host_subplot(111,axes_class=AA.Axes)

ax2 = host.twinx()
p1 = host.bar(x,y1,width,label="hoge")
host.set_ylim(0,1e13)
p2 = ax2.bar(sftx,y2,width,color="red",label="fuga")
ax2.set_ylim(0,1e10)
host.set_xticks(sftx)
host.set_xticklabels(l,rotation = 30)
p = [p1,p2]
host.legend(p,[i.get_label() for i in p])
plt.show()
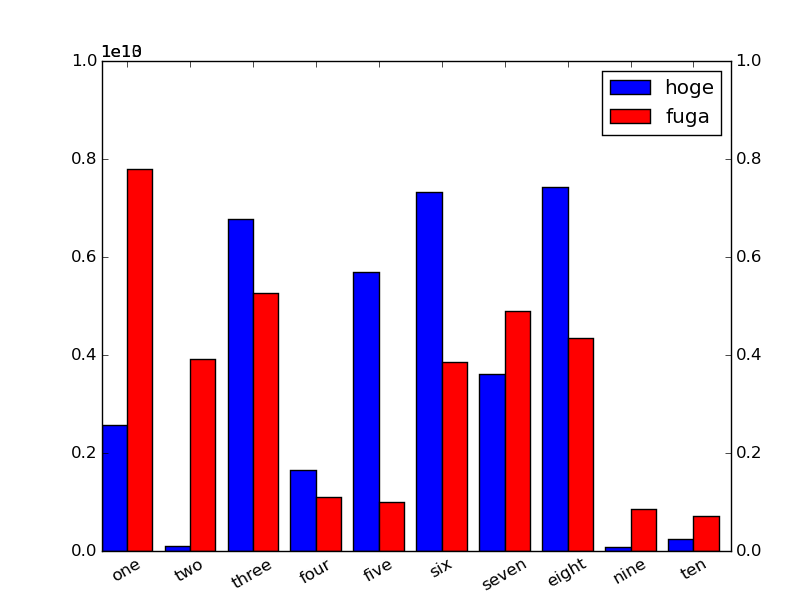
欲しくなかったグラフみっつめ。

グラフの右肩に乗っかって欲しい1e10が左肩に乗っかっている。この辺を参考にしようとして、「これでいいやろ~」とかヘラヘラしながら書くとこんなコードを書いてしまう。
axes_grid example code: demo_parasite_axes2.py — Matplotlib 1.5.0 documentation
書いてしまったゴミ
import matplotlib.pyplot as plt
import numpy as np
import random
from mpl_toolkits.axes_grid1 import host_subplot
import mpl_toolkits.axisartist as AA

width=0.4
x = [i for i in range(10)]
sftx = [i+width for i in x]
l = ["one", "two", "three", "four", "five",
	"six", "seven", "eight", "nine", "ten"]

y1 = [random.random() * 8e12 for i in range(10)]
y2 = [random.random() * 8e9  for i in range(10)]

host = host_subplot(111)

ax2 = host.twinx()
p1 = host.bar(x,y1,width,label="hoge")
host.set_ylim(0,1e13)
p2 = ax2.bar(sftx,y2,width,color="red",label="fuga")
ax2.set_ylim(0,1e10)
host.set_xticks(sftx)
host.set_xticklabels(l,rotation = 30)
p = [p1,p2]
host.legend(p,[i.get_label() for i in p])
plt.show()